English Progress Chart and Skill Tracking
See how your grammar, vocabulary, fluency, and confidence improve over time.
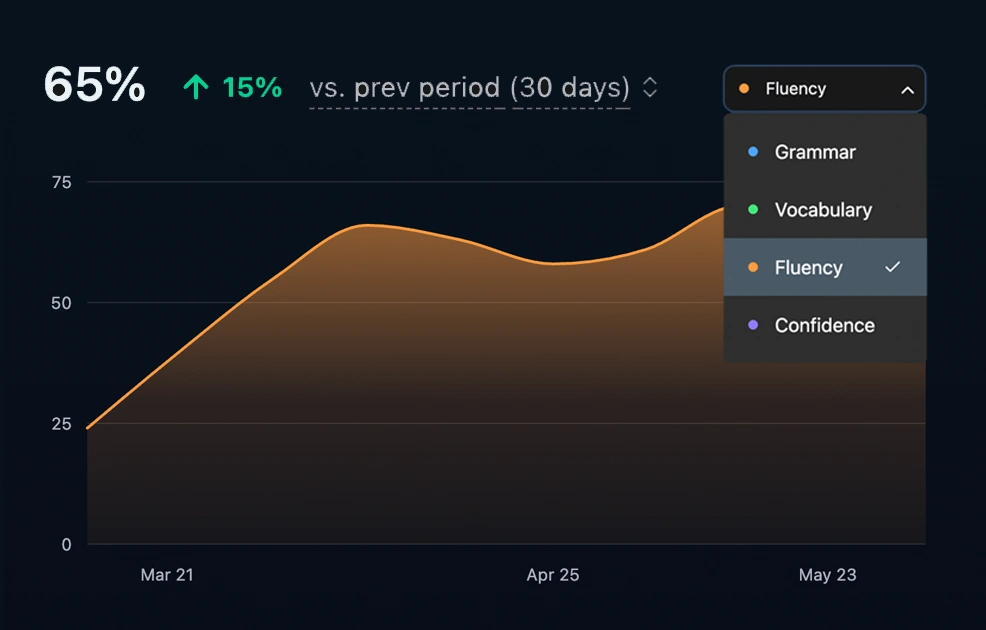
See your English improvement over time
FluencyPal automatically tracks your performance after every conversation, role play, and daily question answer. The Progress Chart turns that data into a clear visual timeline so you can see where you started and how far you have come.
What is measured
After each practice session, the AI evaluates your response across four metrics:
- Grammar — accuracy of sentence structure and grammar rules
- Vocabulary — range and appropriateness of the words you use
- Fluency — how naturally and smoothly you express yourself
- Confidence — how assertive and clear your communication sounds
Each metric is scored independently, so you get a detailed picture of your strengths and the areas that still need work.
How the chart works
The chart shows your scores on a daily timeline. You can:
- switch between metrics to focus on one skill at a time
- view different time periods: last 30 days, last 3 months, last 6 months, or all time
- see a smoothed trend line that filters out day-to-day variation and highlights your real direction of improvement
What the data shows
FluencyPal users who practice daily see an average increase of 5% per month across all metrics. That includes grammar accuracy, vocabulary range, fluency, and speaking confidence.
The chart makes that growth visible. Even small improvements become easy to recognize when you can see the trend over weeks and months.
Why it helps
Progress tracking does more than record what happened. It shows you what is working, keeps you motivated during slow periods, and helps you decide where to focus next. When your chart shows momentum, it becomes easier to keep the habit going.